Custom Vectorworks Plug-In Tools
I've coded three new custom tools for Vectorworks to streamline the drafting process. With "Select By Something", you can choose any field, click a fixture, and all fixtures that have the same value in that field will be highlighted. You can also manually specify a value to select all fixtures with that value in that field. With "Fixture Info", you can click a fixture to see a more concise object info palette with customizable parameters and a built-in gel color preview. With "Color Codes", you can set the symbol color of fixtures grouped by a parameter of your choice.
A pilot study on the effectiveness of these tools in assisting beginning lighting design students was conducted as a project for the class "Designing Expressive Technologies". The code is written in Vectorscript (Pascal).
Additional tools are in development and the entire set will be made available for public usage coming soon.
Rogue Wrangler
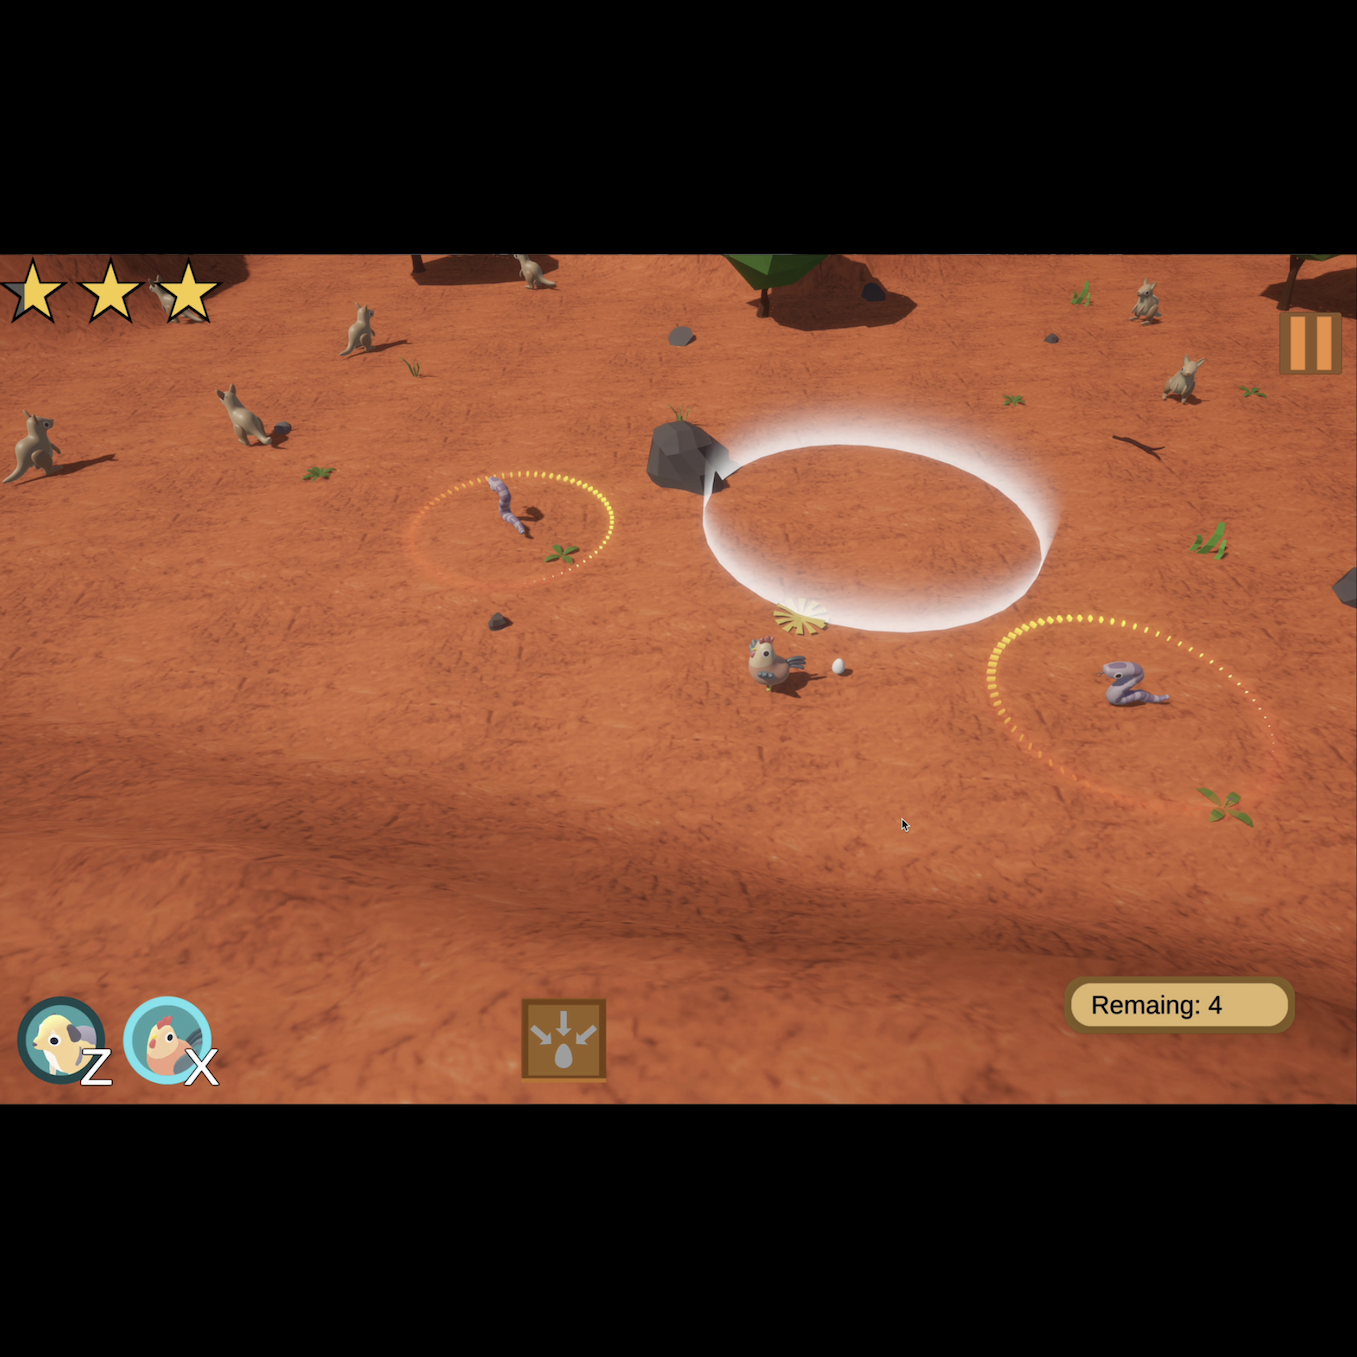
For my final project in "Intro to Game Development", a class through UCSB Electrical and Computer Engineering, I created "Rogue Wrangler", a 3D arcade adventure where the player inhabits an eager shapeshifter assisting a group of cranky scientists in their wildlife studies. The player explores different environments and uses each animal's special abilities to solve levels, unlocking new animal forms and biomes. The game was created in Unity, with code in C#.
Data Visualization
The UCSB Global Media Technologies and Cultures lab does a lot of work in collecting data from various company reports around they world. What they were looking for was a way to make that information digestible to the general public. I developed various interactive data visualizations in javascript that gave both a clear and intuitive sense of the information conveyed. It was also important that these visualizations were generative, adapting dynamically to whatever data is input, making these pieces reusable.
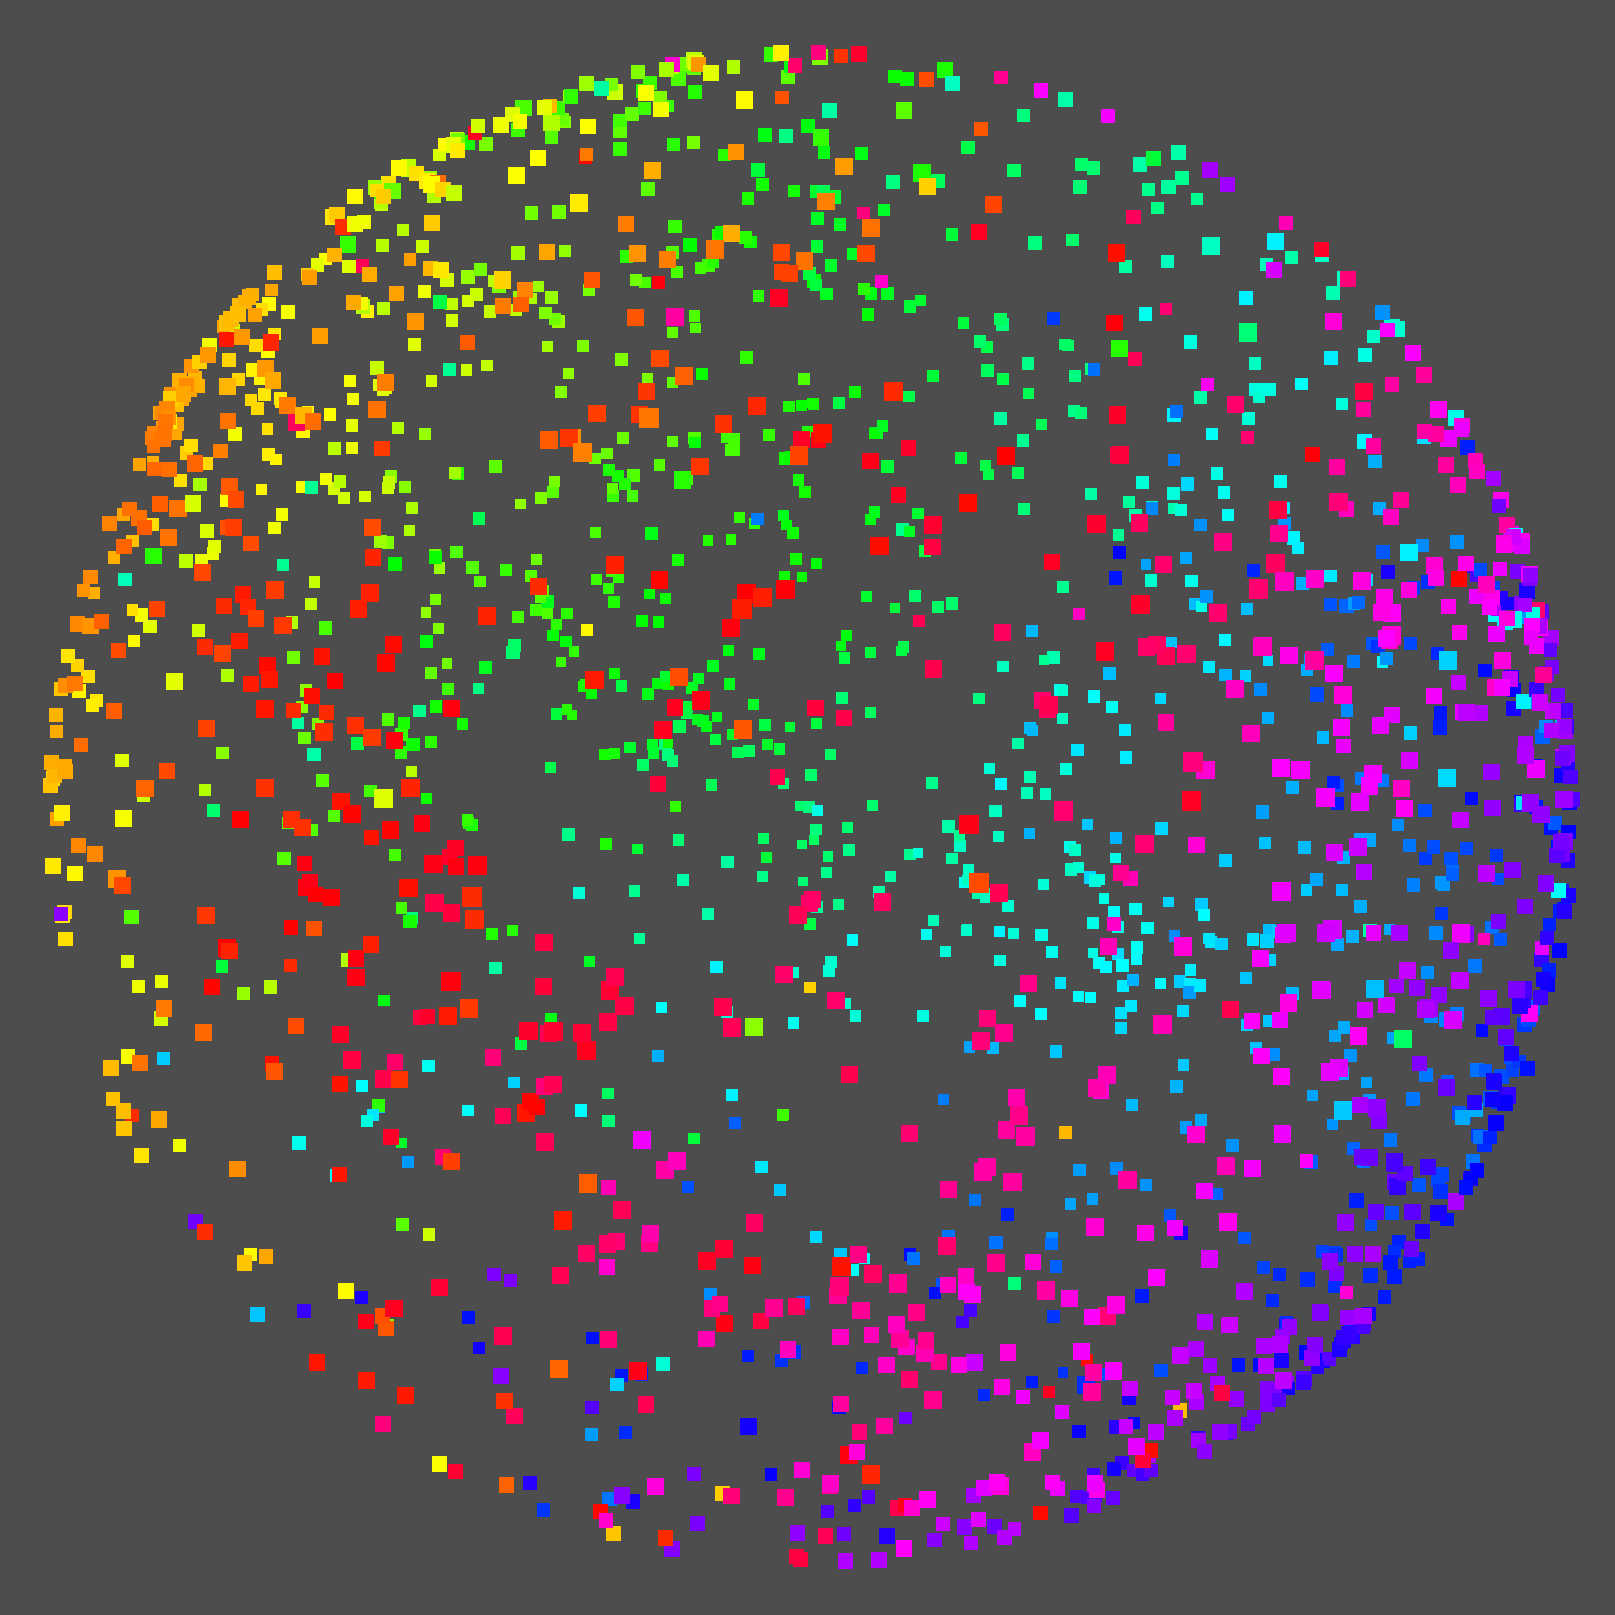
This example demonstrates the land ownership of companies under different categories. The goal here was to make the data, areas in the millions of square feet, more understandable by comparing it to well known sizes.
Projects in Allolib
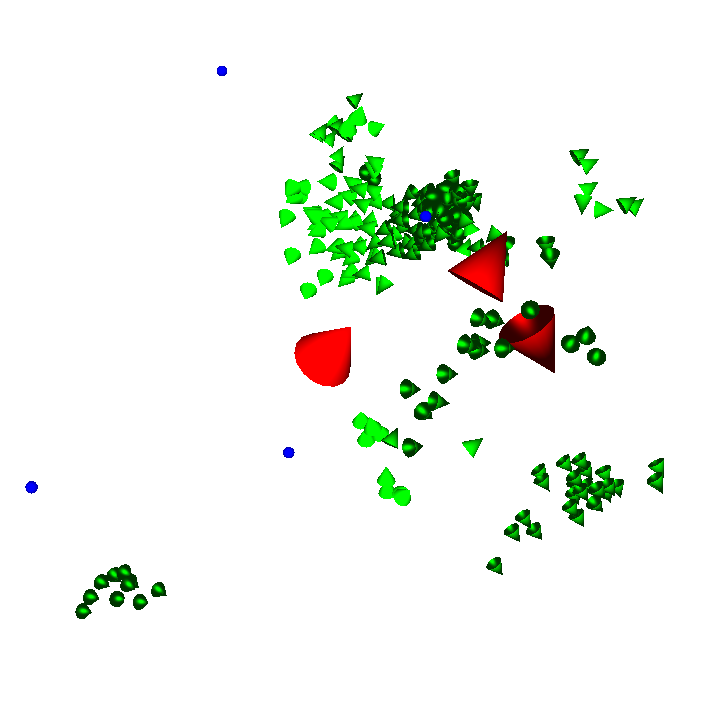
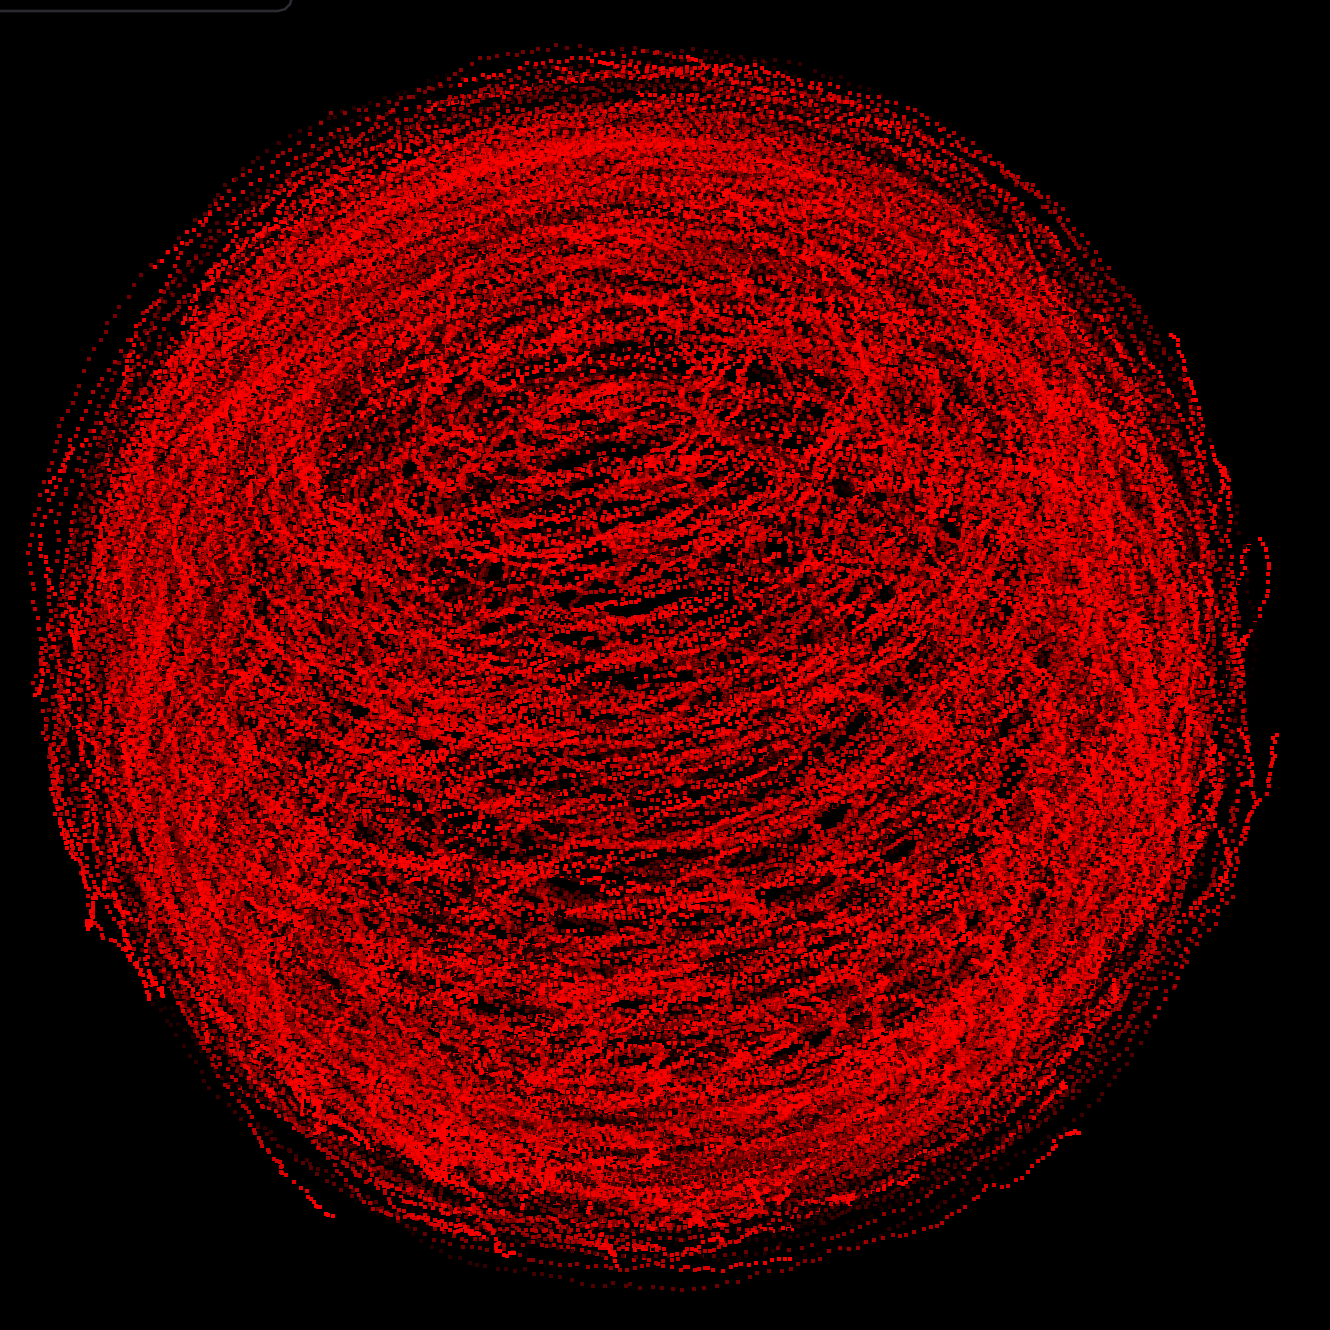
UCSB is home to the Allosphere, a 30-foot tall sphere with full surface projection coverage inside of it. In a graduate level class in the Media Arts and Technology program, I learned about creating visuals for the Allosphere through its C++ framework, allolib. It's an exciting mix of object oriented programming, computer graphics, and physics simulation.